LAS VEGAS — NielsenIQ set the stage for current nutrition trends and pet owner preferences at SuperZoo 2022, held Aug. 23 to 25 in Las Vegas. The market research firm presented its latest pet industry data at the Show Floor Talks section of the show floor on Wednesday, Aug. 24.
According to Sherry Frey and Hannah Polk of NielsenIQ, consumers are continuing to leverage omnichannel opportunities to purchase their pet products. In 2021, both in-store and online pet care purchases outpaced other departments in terms of year-over-year growth in dollar sales. For example, in-store pet care sales were up 9.2% compared to 2020, while online sales grew 22.6%, according to NielsenIQ.
While brick-and-mortar buyers still make up the majority, e-commerce and omnichannel opportunities are not done growing. Those purchasing pet food exclusively in a brick-and-mortar store made up 68% of total buyers in 2021, representing roughly 44% of total dollar sales for the category. Online-only pet food shoppers accounted for 3% of total buyers and 3% of total dollar sales, but these rates are up 13.7% and 28.1%, respectively, compared to 2020 behaviors.
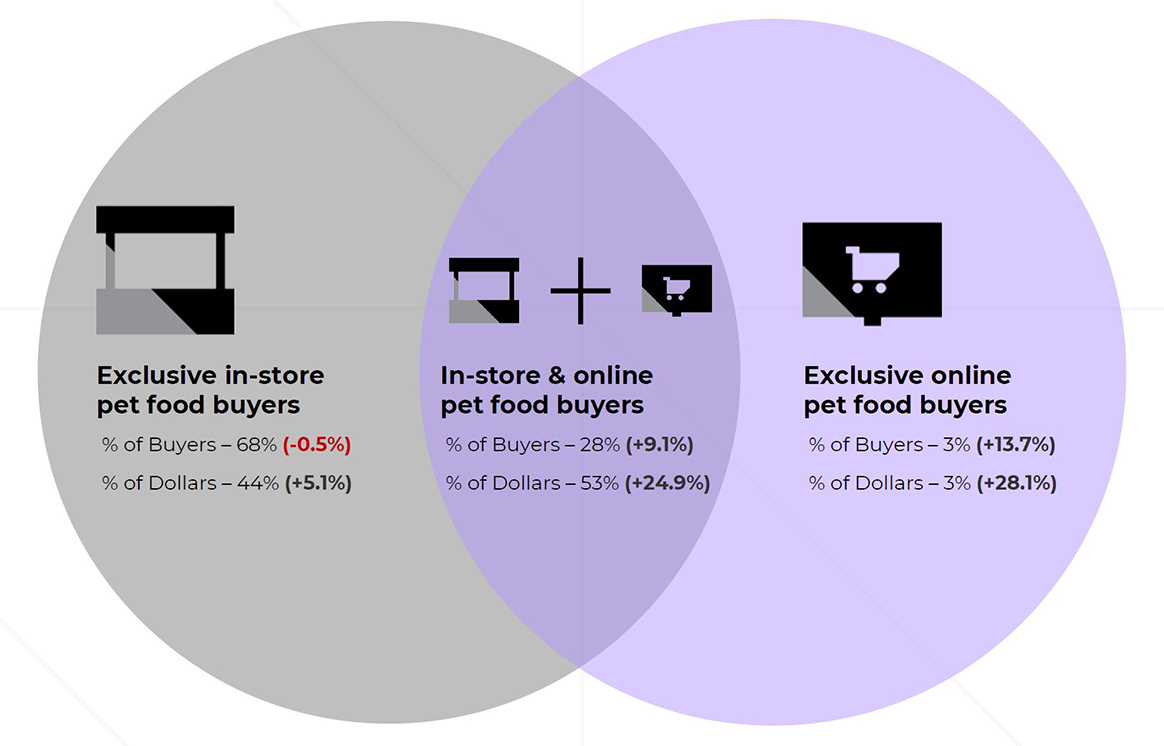 Source: NielsenIQ; Omnishopper Panel; BED; Syndicated Hierarchy; 52 weeks ended Jan. 29, 2022 vs previous period
 NielsenIQ noted that omnichannel shoppers — those buying both in store and online — are also growing. In 2021, 28% of all buyers shopped omnichannel, up 9.1% from 2020, while accounting for 53% of total dollar sales, up 24.9% from 2020.
“It's not as much an “either-or,” or a competition,” Frey said. “It really is figuring out what is that right mix and that right blend between your online and your in-store strategy. I do want to say, in store is not dead when it comes to pet.”
Packaged Facts, another market research firm operating in the pet product space, recently shared its own pet specialty and e-commerce sales data. According to Packaged Facts’ “US Pet Market Focus: Pet Stores & Pet Specialty Retailing” report, combined pet specialty and e-commerce sales currently sit at $31 billion, up 18% from year-ago sales.
These growing sales are coupled with inflation for consumer goods, including for pet food and treat products.
"Manufacturers across the pet market have slowly increased their prices, spurred by challenges in acquiring ingredients, packaging materials, and a host of other items that go into making and selling pet products,” said Shannon Brown, report analyst at Packaged Facts.
Economic pressures related to raw material sourcing and distribution have caused across-the-board price increases for pet food and treat products, as well as some empty store shelves. According to Packaged Facts, 59% of pet owners report spending more on pet products than they used to, compared to 45% in 2021.
Additionally, 56% of pet owners agree that many pet products are becoming too expensive, and 66% of pet owners are actively looking for lower prices, special offers and sales on the pet products they buy. Roughly 20% of pet owners report spending less on pet products due to the current economy.
Protein preferences
Polk shared the most frequently used animal protein sources for pet food in NielsenIQ’s SuperZoo 2022 presentation. Chicken remains the most widely used protein source from August 2021 to July 2022, with $16.9 billion worth of product including chicken proteins in their formulas. Three-year trend lines for this protein show industry sales of chicken protein products over this period were up 12% from year-ago sales, 18.9% from two years ago, and 24.8% from three years ago.
“Here, we're really seeing three major things,” Polk said. “The first being that chicken and fish have the largest share in terms of sales. I don't think this is super surprising. A lot of products are formulated with these ingredients but, secondly, we can see that all of these protein types have actually increased in sales over the past three years, which I think can be attributed to a number of things, whether it be the pure increase of pet ownership in the past three years as well as everything that's going on with price inflation, affecting the increase in sales. Then lastly, we can see that pork and fish are actually the two protein types that have increased most significantly over the past year.”
The inclusion of duck proteins accounts for only $547 million worth of product, but has grown 9.7% from year-ago, 11.5% from two years ago, and 5.3% from three years ago. The use of lamb proteins, which currently accounts for $1.7 billion worth of product, was up 11.8% from year-ago, 11.2% from two years ago, and 5.3% from three years ago, indicating more lamb-based products are entering the market.
Fish proteins are also growing in popularity, accounting for $10.4 billion in product and up 13.4% from year-ago, 15.2% from two years ago, and 26% from three years ago. Additionally, search volume growth for tuna was up roughly 14% from August 2021 to July 2022, while seafood searches grew by more than 25%, shrimp by roughly 20%, and salmon by approximately 4%. Salmon was the second most-searched protein by search volume over this period at just under 400,000 queries.
The use of pork protein, which currently accounts for $2.8 billion worth of product sales, is also trending. Usage of this protein source was up 15.5% from year-ago, 30.6% from two years ago, and 25.2% from three years ago. Turkey-based products are rising in the ranks as well, accounting for $3.1 billion worth of product and up 13.4% from year-ago, 15.2% from two years ago and 14.4% from three years ago. The use of beef proteins has grown steadily over the last three years, currently accounting for $7.5 billion in product and growing 12.3% from year-ago, 16.5% from two years ago, and 21.9% from three years ago.
These protein trends directly overlap with another trend taking the pet care space by storm — sustainability. Several brands are turning to plant-based proteins, lab-cultured protein alternatives that eliminate the need for slaughtered or rendered protein sources, and insect proteins.
Additionally, online searches for “high protein” dog food products are still on the rise, with search volumes up 39% to 39,300 searches from August 2021 to July 2022. This coincides with two other growing search terms — “dehydrated,” which grew 30% to 271,600 searches, and “freeze dried,” which grew 28% to 218,200 searches, over the same period. Growing interest in these three categories is driving more companies to enter the freeze-dried and air-dried pet food and treat market, as evidenced on the SuperZoo 2022 show floor.
Food as medicine and other opportunities
The trend toward functional pet nutrition products continues, stoked by increasing interest in products that support mental health and physical wellbeing, as well as those that target specific pet ailments.
According to NielsenIQ, sales of pet products marketed to address mood and stress health have grown 34% over the last 52 weeks ended Aug. 6, 2022. Performance support product sales are up 32%, urinary health product sales grew 27%, and kidney health product sales are up 22%.
“Mental health is not just something that's being prioritized in human food, but also pet food,” Polk shared.
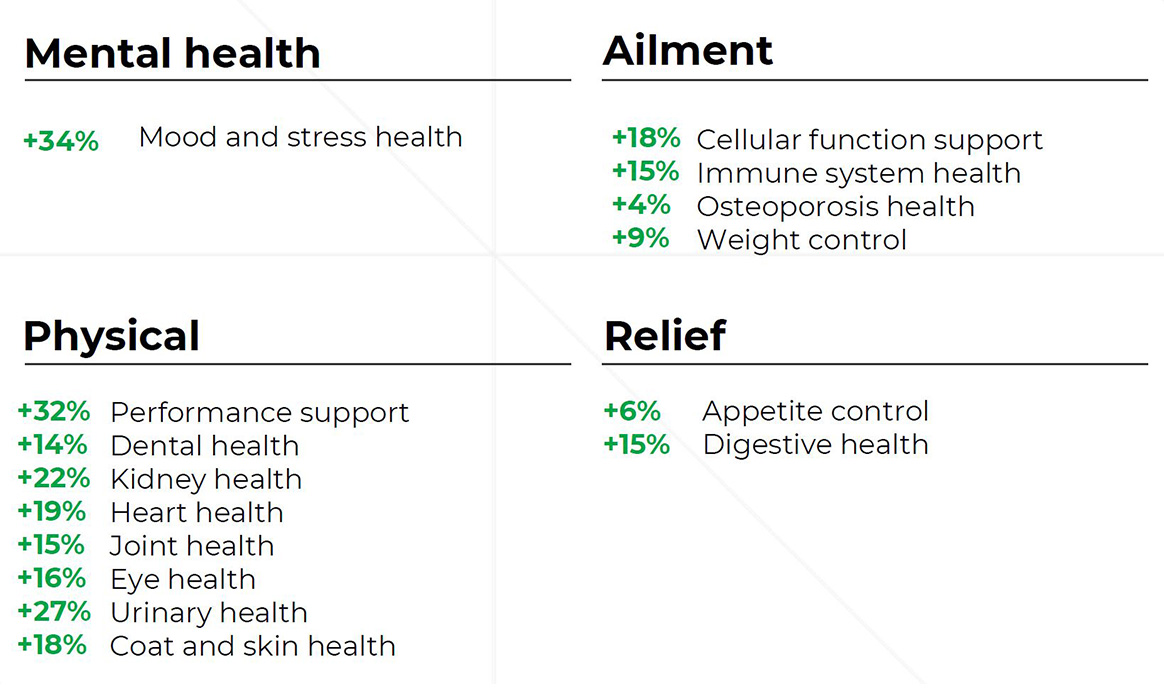 Source: NielsenIQ Retail Measurement Services, NielsenIQ Product Insights, powered by Label Insight; Total Pet Food; Total US xAOC + Pet Retailer; 52 weeks ended Aug. 6, 2022 vs year-ago stated attributes
 Other “food as medicine” products growing in sales include heart health products (up 19%), skin and coat health (up 18%), cellular function support (up 18%), eye health (up 16%), joint health (up 15%), immune system health (up 15%), digestive health (up 15%), and dental health (up 14%).
As part of this research, NielsenIQ analyzed the search capabilities of more than 40 different retailers, including Walmart, Kroger, Chewy, Petco, PetSmart and others, to determine the discoverability of functional wellness products for pets. The firm found that all retailers included in the analysis offer some type of product filtering on their websites for specific need states and product attributes, reinforcing the notion that both product brands and retailers are catering to growing pet owner demand for health and wellness products.
From August 2021 to July 2022, consumer searches for dental health products vastly outnumbered search volumes for other functional categories such as calming and sensitive stomach. Dental health searches exceeded 1.5 million over this period, but significant growth in searches for hairball control (up more than 70%) and anxiety health products (up more than 60%) indicates growing interest in these two functional categories across dog and cat food.
“Dental health exceeds other need states pretty significantly when it comes to peer search volume,” Polk said. “I was personally surprised at how many consumers are searching [for] calming; that was before I started walking the floor and seeing all these brands addressing calming as a need state with formulations with ashwagandha, CBD, chamomile, melatonin — all really having these different calming effects on pet.”
NielsenIQ shared several detailed data points on the latest trending search terms used by dog and cat owners online. The firm separated these terms into two categories — general product attributes and functional attributes that play into the “food as medicine” trend.
Dog food searches in the “food as medicine” vein showed increased interest in anxiety health, holistic nutrition, calming products, and dental and breath health. Search volumes for dog food targeting “anxiety health” grew 87% to 24,300 searches from August 2021 to July 2022, while “holistic” dog food searches were up 28% to 32,100. “Calming” dog food product searches grew 23% to 208,000, and “dental and breath health” searches were up 22% to 660,300.
“We're also seeing sensitive stomach and digestive health is something that's becoming a really big theme in dog food, as more and more humans are becoming intact with their dogs’ sensitivities to food and really noticing those dietary allergens,” Polk shared. “…I think often foods that are marketed toward these sensitive stomachs or digestive health are either having some type of prebiotic or probiotic content to aid digestion… or those limited ingredient diets for those sensitive stomached pets.”
Other trending dog food search attributes include those for “high protein,” “dehydrated” and “freeze dried” products, as noted previously, as well as “wet” diets, up 15% to 1.94 million searches, “canned” dog food, up 22% to 1.04 million searches, “refrigerated” dog food, up 15% to 91,400 searches, and “fresh” dog food, up 6% to 112,700 searches. Search volumes for “vegetarian” and “moist” dog food were up slightly over this period, at 5% and 2% growth, respectively.
“Refrigerated and fresh seem to be continuously growing year over year,” Polk added.
In the cat food arena, pet owners are searching for specific product attributes, ingredients, and “food as medicine” attributes. Search volumes for “variety pack” were up 302% from August 2021 to July 2022, while searches for “grilled” cat food products grew 266%, “shredded” searches were up 226%, and “gourmet” searches grew 84%.
Search queries for cat food products containing “liver” were up 99% over this period, with “gravy” searches growing 91%, and “duck” searches up 76%. Other specific protein searches included “chicken” (up 47%,) “tuna” (up 43%), “beef” (up 41%), “seafood” (up 29%), and “salmon” (up 25%).
In the food as medicine category, cat owners are searching for products with “holistic,” “hairball control” and “calming” attributes first and foremost. Search volumes for “holistic” cat food products grew 172%, searches for “hairball control” products were up 60%, and searches for “calming” cat food products grew 42%. Other growing search queries for cat food include those for “weight control” (up 31%), “allergy friendly” (up 23%), “sensitive stomach” (up 20%), “urinary tract health” (up 5%), and “dental and breath health” (up 4%).
Supplement sales
NielsenIQ also shared pet supplement sales are outpacing those of human supplement sales. For example, sales of pet supplements were up 11% from August 2021 to August 2022, compared to just 6% sales growth for human supplements, vitamins and minerals. Pet supplement sales exceeded $510 million during this period, up 50% from pet supplement sales three years ago.
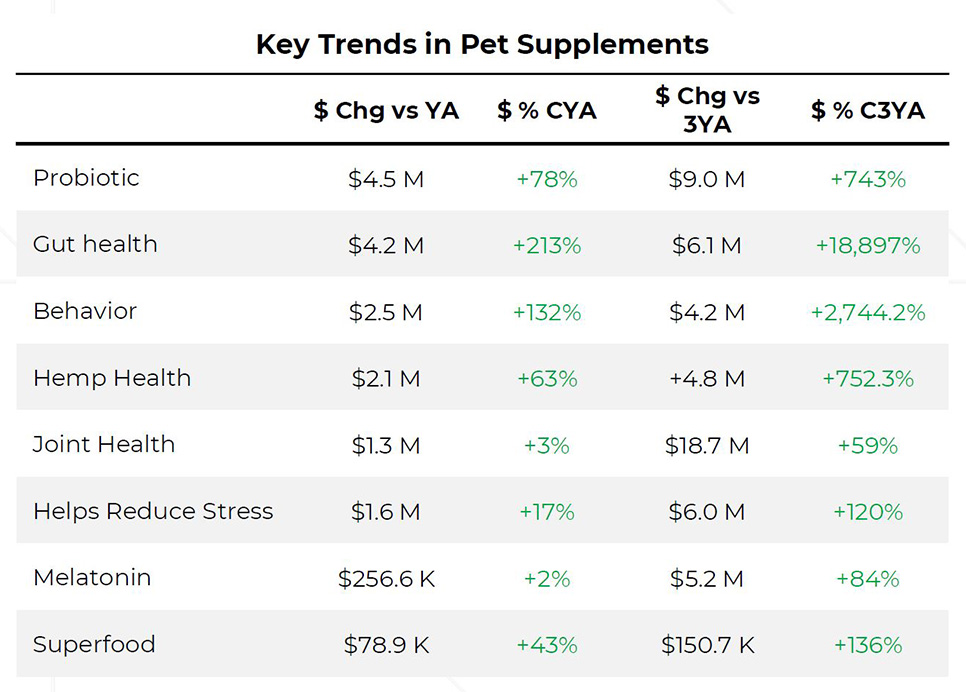 Source: NielsenIQ Retail Measurement Services; Pet supplements; Total US xAOC + Pet Retail; 52 weeks ended Aug. 13, 2022
 Several opportunities stand out in the pet supplement category, including specific ingredients and health needs. For example, sales of supplements containing probiotics are up 78%, gut health supplement sales are up 213%, and sales of supplements targeting behavior are up 132%. Hemp health supplement sales are also growing, up 63% from year-ago sales, while superfood supplement sales are up 43%, stress-reducing supplement sales are up 17%, joint health supplement sales have grown 3%, and pet supplements with melatonin are up 2%.
While the use of hemp-based ingredients in animal feed and pet food products remains unclear from a regulatory standpoint, the CBD pet product category is continuing on a rapid growth path. According to NielsenIQ, CBD pet supplement sales topped $48.3 million from August 2021 to August 2022, up 22% from year-ago sales and up 236% from three years ago. CBD pet food product sales are also on the rise, totaling $34.1 million in sales over the same period, up 35% from year-ago and 377% from three years ago.
These trends — including spending sentiments and channel preferences, protein shifts, and the importance of functional nutrition — will continue to drive the pet food, treat and supplement industry forward despite ongoing supply chain and economic disruptions.
Keep up with the latest pet food trends on our Trends page.