CHICAGO — NielsenIQ released in-depth data on trending pet food claims and attributes this May, revealing growing label claims, consumer search trends and the popularity of the refrigerated frozen segment from December 2021 to January 2022.
Label claim trends
In the growing segment of pet food claims, NielsenIQ found a surprising lack of pet food companies taking advantage of consumer trending attributes. According to the company’s pet food database, which is comprised of more than 22,000 products, the major trending attributes include quality ingredients, artificial free and specialty diet claims, which the company detailed in its trending product claims data.
Within quality ingredients, NielsenIQ investigated both “meat as the first ingredient” and “no animal byproducts” claims. For “meat as the first ingredient,” the company found that 49.1% of pet foods qualify for the claim, yet 71.5% do not use the claim on labeling. This label category has amassed to $4.7 billion, increasing 7.9% in the past two years.
NielsenIQ estimates that 56.6% of pet food products qualify for the “no animal byproducts” claim, however, 95.9% of these products are not using it. NielsenIQ states this is a missed opportunity for brands, as products without the “no animal byproducts” claim are missing out on the $520 million market, which has grown 20.8%.
Among artificial free products, NielsenIQ zeroed in on “free from artificial flavors,” “free from artificial preservatives,” and “free of artificial colors” claims.
NielsenIQ found that 90.3% of pet foods qualify for the "free from artificial flavors" claim, yet 68.3% of these products are not explicitly making the claim on packaging. The market for this product attribute category is estimated at $8.7 billion and has grown 13.5%.
Though the “free from artificial preservatives,” segment has grown 14.9% to $6.5 billion, 59.5% of the products that qualify for the claim do not use it on packaging. The claim “free of artificial colors” has also witnessed strong growth, amassing to a $3.6 billion market, but 69.7% of products qualifying for the claim do not use it.
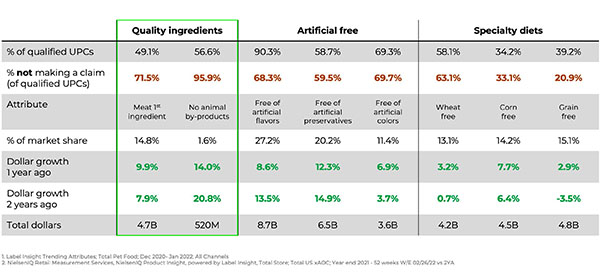
In the specialty diets category, NielsenIQ focused on “wheat-free,” “corn-free” and “grain free” claims in pet food. The company found that 58.1% of products on the market qualify for the claim, but 63.1% of products do not use it, skirting a $4.2 billion market.
NielsenIQ also found that 34.2% of products are corn-free, yet 33.1% do not state the claim on packaging. The corn-free market within pet food has grown 6.4% in the past two years to a $4.5 billion market. Though the “grain-free” claim has amassed to a $4.8 billion market, 20.9% of products do not take advantage of the claim on packaging.
Consumer search trends vs attributes
In analyzing pet food products, NielsenIQ compared product attributes with those of consumer trends. According to the company, most pet foods are not taking advantage of the largest growing consumer searches.
To date, the highest growing consumer search terms include calming, hairball control, high calorie, low calorie, seafood ingredients and lick-able, all of which have the smallest markets within label claims. According to NielsenIQ, though “calming” is an extremely popular search, detailed in its consumer search data, only 0.1% of pet products are using the claim on packaging. In the past two years, searches for “calming” have increased 41% to 190,758 searches total.
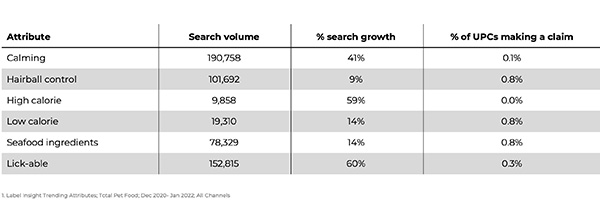
The search term “high calorie” has also witnessed strong growth, increasing 59% to a total of 9,858 searches, yet NielsenIQ found a complete lack of products using the claim.
NielsenIQ also noted that “lick-able” is experiencing 60% growth to a total of 152,815 searches. Despite its growing popularity, only 0.3% of pet food products are claiming the attribute.
Refrigerated and frozen growth
Though a small category in the market, the refrigerated and frozen segment is experiencing increasing popularity among consumers. According to NielsenIQ, the segment has witnessed a drastic increase in sales. Since last year, sales for frozen products increased 36% and refrigerated product sales increased drastically by 70.3%.
Though the total sales for this segment show strong promise, NielsenIQ noted that its database of frozen pet food accounts for less than 1% of the total market, and refrigerated pet food accounts for less than 5%. Consumers are expressing more interest in the category even though the total number of products remains low.
Stay up to date on the latest pet food processing industry headlines on our News page.