KANSAS CITY, MO. — How did the pet landscape change in 2020, and what’s next for the industry? Two specialists from NielsenIQ — Brad Boldridge, retail client director, and Sam Smith, client manager — answered these questions with key pet industry data in their presentation at Global Pet Expo Digital Access on March 25.
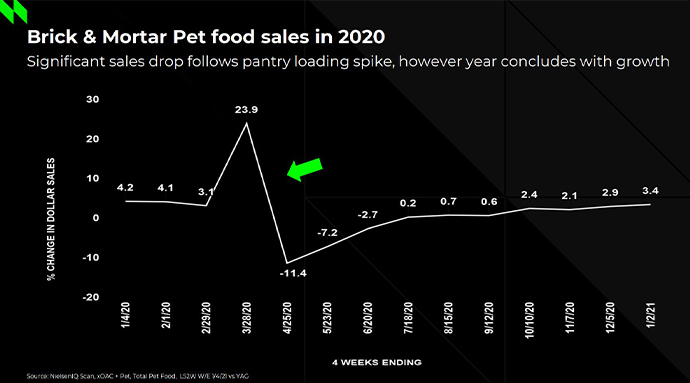
“As we know, the pet category is absolutely resilient, and it made its way back to positive growth trends by mid-summer and finished the year very, very strong,” Boldridge said. “This was not the trend in most other non-pet or durable categories, who actually experienced growth throughout the pandemic… they didn’t have to really come back – it was more of a continued trend that they saw throughout the pandemic.”
Boldridge and Smith shared several key trends for product purchasing, emerging ingredient claims and product categories, and the continued impact of the US Food and Drug Administration’s (FDA) investigation into canine dilated cardiomyopathy (DCM) and its alleged link to grain-free dog foods.
Up-and-coming pet food categories
Smith took a deep dive into some emerging pet food formats and ingredient claims driving sales growth in the pet specialty channel.
“A large portion of the ingredient claims that were seen are these small pockets that are really growing strong across pet food in 2020,” he said.
In terms of dollar value, pet food products with natural ingredient claims continue to be the largest player in the pet specialty space, accounting for $5.6 billion in sales and 66% of the pet specialty market share at an average $3.12 per lb. However, this trend declined 6% compared to 2019 to make room for other growing formats, Smith said.
These up-and-coming products include dehydrated and freeze-dried pet foods, frozen, refrigerated and fresh pet foods, and meal enhancers.
According to NielsenIQ, refrigerated and fresh pet foods are growing at the fastest rate among these five categories, coming in at 20.7% growth in 2020, but still only make up 1% of the market. These products have an average price per lb of $5.62 and came in at roughly $78.3 million in sales last year.
Dehydrated dog foods represented the highest revenue of these five emerging pet food categories, with $304.3 million in sales, and grew 10.7% in 2020. They made up 3.5% of the pet specialty market and average $12.10 per lb.
Freeze-dried and frozen pet foods collected $239.9 million and $236.1 million in sales respectively, both making up 2.8% of the market. However, freeze-dried pet foods are growing more slowly (up 7% versus 2019) and cost remarkably more at an average $32.45 per lb compared to frozen pet foods, which grew 14% last year and average $6.34 per lb.
Meal enhancers grew 5.9% in 2020 to $165.5 million in sales, accounting for 1.9% of the pet specialty market and coming in at an average $8.39 per lb.
“These claims are really what’s driving the trends across pet food, and the price premiumization is where we’re seeing the focus there,” Smith said. “…Not only are these more premium claims and more premium products, but they are actually driving growth, indicating a shift in consumers actually seeking out these products, whether they are the full and complete meal that’s being fed to their pets or as a topper or an additive to provide supplemental nutrition. [This is] definitely leading toward higher margins for manufacturers and retailers who are making and stocking these types of products.”
He shared shelf-stable wet pet foods are continuing to do well at $1.32 billion in sales and 1.5% growth in 2020, but there is stiff competition in the fresh/refrigerated and frozen categories. Fresh/refrigerated pet foods gathered $69.3 million in sales and grew nearly 20% in 2020, while frozen pet foods took $225.7 million in sales and grew nearly 14%.
For total pet specialty retail in the United States, fresh/refrigerated pet foods cost an average of $5.38 per lb while frozen pet foods are more expensive, averaging $6.24 per lb.
“The mentality of premiumization is not driving consumers away from these types of products and these types of claims, they’re actually seeking these out,” Smith said.
All of the above
Smith also shared some interesting data from NielsenIQ’s Homescan Panel, which looks at household purchases in different categories, as well as household purchases that overlap multiple categories including wet pet food, dry pet food and treats. The data is also segmented by dog-owning households and cat-owning households, and households that own both dogs and cats.
Overall, dog owners tend to lean toward dry food and treats, while cat owners skew toward dry and wet foods with fewer tendencies for treats.
Thirty percent of dog owners buy wet food, dry food and treats, while 11% buy only dry dog food, 17% buy only treats, and 2% buy only wet dog food. Moreover, 29% of dog owners tend to purchase dry food and treats only, 6% tend to purchase treats and wet dog food only, and 4% purchase both wet and dry dog foods.
On the cat side, 34% of cat owners purchase all three categories – wet food, dry food and treats. Nineteen percent purchase dry cat food only, 7% tend to purchase only wet cat food, and just 5% purchase treats. Additionally, 17% of cat owners tend to purchase both wet and dry cat foods, 11% purchase dry cat food and treats only, and 6% purchase wet cat food and treats only.
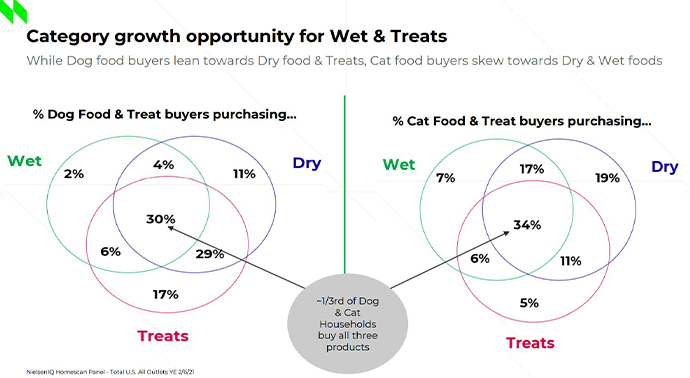
According to the data, roughly 33% of dog and cat households purchase all three categories: wet food, dry food and treats. This confirms an overarching pet industry trends toward mealtime variety and combination feeding.
“Now what’s really impressive when you extrapolate these to a volume threshold is that we find the 30% of [dog food and treat] buyers that purchase at least one of each [type of] product make up over 50% of all the dollar volume,” Smith said. “…And for cat food it’s even more drastic. Thirty-four percent of households purchase one of each product and 63% of the dollars are attributed to that. Essentially, one third of the households are making up two-thirds of the dollar for cat, and one third of the households are making up 50% of the dollars for dog.”
Continued impacts of the DCM debacle
In July 2018, the FDA began warning consumers of a potential link between grain-free dog foods and an uptick in a canine heart disease, DCM. By June 2019, the agency explicitly implicated several brands of grain-free dog food in its investigation, followed by a slow but steady rollout of more grain-inclusive diets throughout the industry.
By 2020, pet nutritionists and pet food companies began releasing data that showed no conclusive evidence of a link between canine DCM and grain-free dog diets and, finally in November, the FDA walked back from its previous statements and confirmed there was no causal evidence of grain-free dog foods causing the canine heart disease.
“Unfortunately, the pet food category had been dealing with this issue since the middle of 2018 and, not surprising, over two years later, there was going to be a great impact,” Boldridge said.
Nielsen IQ compared grain-free dog food trends with grain-inclusive dog food trends in the brick-and-mortar retail space, including mainstream and pet specialty retailers. This comparison revealed total grain-free dry dog food has been on a steady decline since June 2018 in this channel.
Brands who were named directly in the FDA’s investigation experienced steeper declines up until the last half of 2020, while unnamed brands continue to experience softer declines, Boldridge shared.
“Sales in the second half of 2020 still declined, but that continuous decline that was happening had stopped,” Boldridge said.
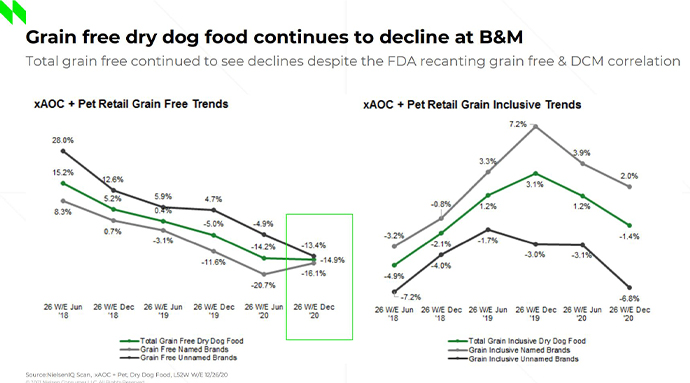
Total grain-free dry dog food sales, which were up 15.2% in June 2018, ended 2020 down 14.9%. Brands of grain-free dog food that were named in the FDA’s investigation, which showed 8.3% growth in June 2018, were down 20.7% in June 2020 and recovered slightly to -16.1% by the end of 2020. Unnamed grain-free dog food brands, which showed 28% growth in June 2018, dropped to -13.4% by the end of 2020.
Fittingly, grain-inclusive dog food sales experienced a growth spike in 2019. Total sales growth for grain-free dog foods grew from -4.9% in June 2018 to 3.1% growth by December 2019, falling again to -1.4% by the end of 2020.
“Total grain-inclusive dry dog food trends were actually down 5% at the start of the investigation, but they managed to achieve a positive 3% growth by the end of 2019, and then those sales did slow in 2020,” Boldridge said, emphasizing the pandemic’s possible impacts on grain-inclusive dry dog food sales unrelated to the DCM investigation.
“Certainly, there was an impact,” Boldridge concluded. “We saw a 19% shift in volume from grain-free dry dog food over to grain-inclusive.”
Read more of our Global Pet Expo coverage.
Keep up with the latest pet food trends on our Trends page.