ORLANDO, FLA. — The rising trend in omnichannel, or purchasing both in-store and online, is proving extremely fruitful for the pet care and pet food industries, according to the latest data from NielsenIQ. Additionally, pet food consumers are forging the path online, giving way to subscription-based purchases.
Andrea Binder, vice president of North America retail — pet at NielsenIQ, discussed these trends in NielsenIQ’s “State of Pet: The Full View of the Omni Pet Channel & Shopper” report presented on March 20 during Global Pet Expo 2024. The data spans the entire year of 2023, ending on Dec. 30.
Omnichannel continues to grow
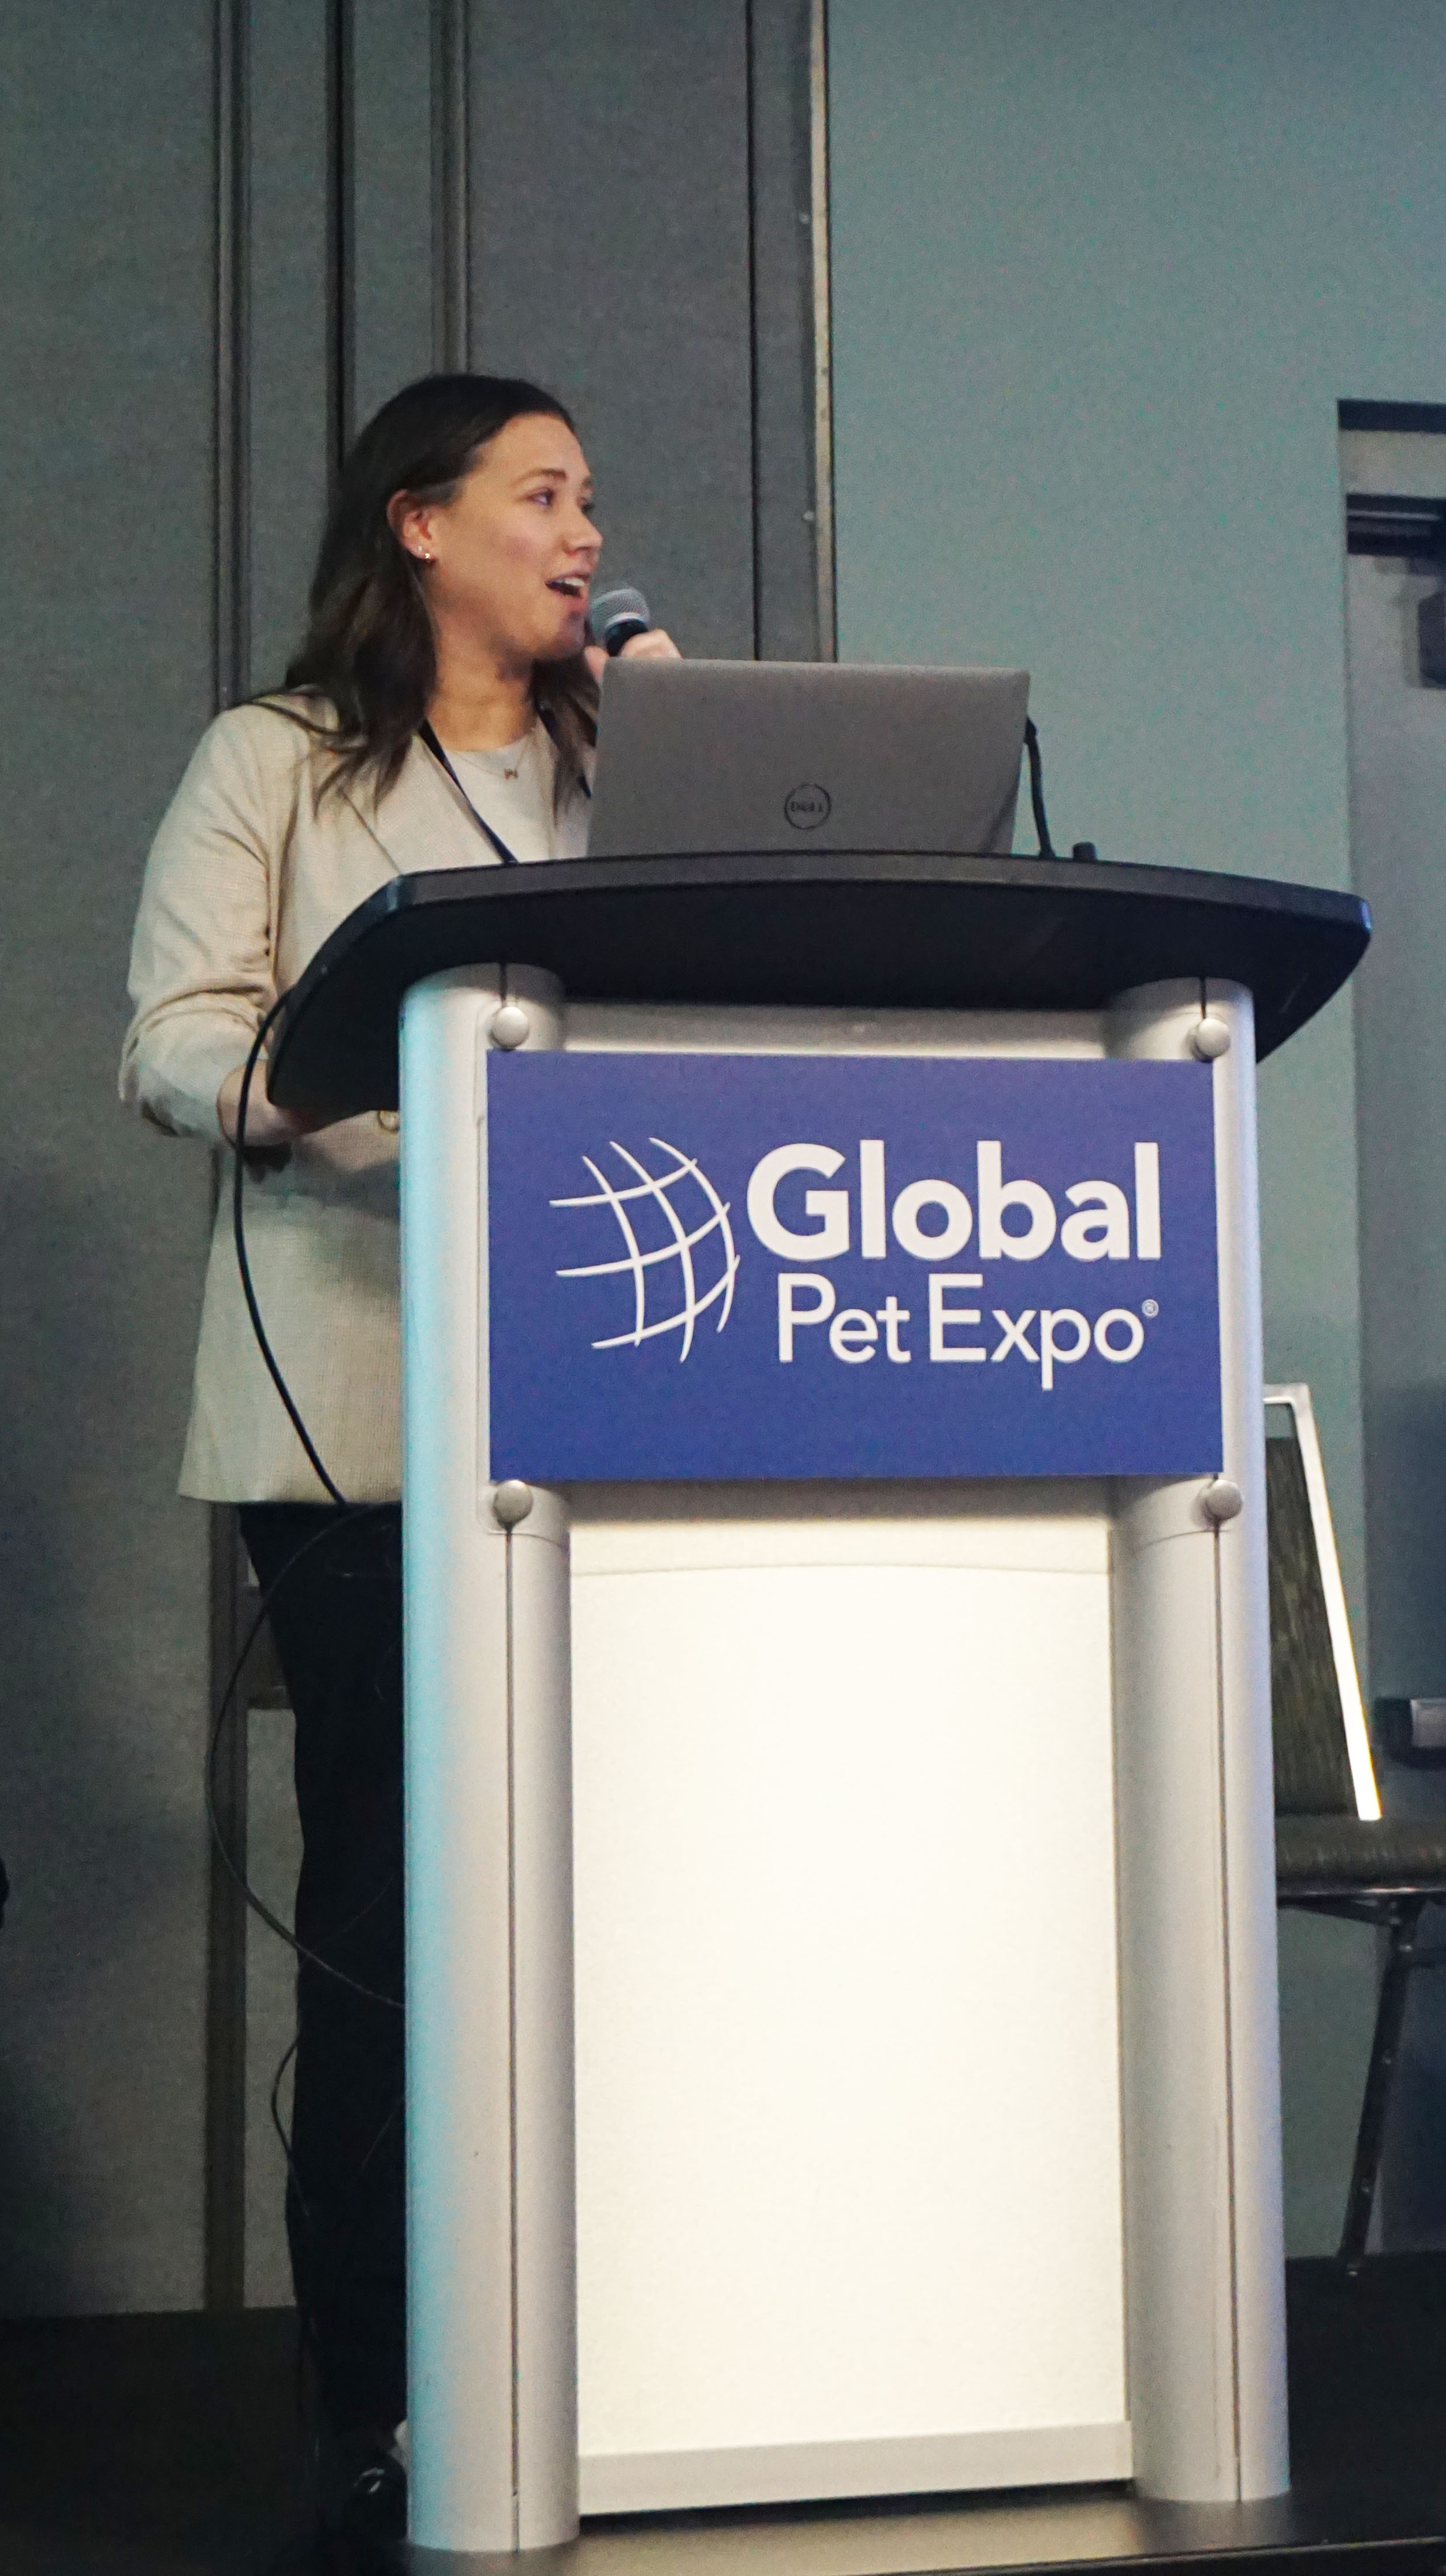
Andrea Binder, vice president of North America retail — pet at NielsenIQ, took an omni view of the pet industry.
| Source: Sosland Publishing Co. / Nicole KerwinBinder took the stage to discuss the continued trend in omnichannel retail, revealing that total pet care retail sales for 2023 hit $82.8 billion, an increase of 8.2% from year-ago. Of these sales, brick-and-mortar retailers still hold the largest share at 61%, an increase of 5% from 2022. However, online retailers are holding their ground at 39% of sales, an increase of 13.4% from 2022.
Pet care omni sales represent a much smaller piece of the pie compared to the human food, general merchandise (gen merch), health and beauty, and other industries. But the pet industry’s in-store and online sales are far eclipsing every other industry.
“Over the last year, we saw some of the other departments start to gain back and grow faster than pet,” she said. “Now, within the year of 2023, we did see pet regain that fastest growing department title again, both in-store and online.”
In-store dollar sales increased 5% and online dollar sales increased 13.4% in 2023 for the pet care segment. For reference, human food experienced an in-store rise of 3.9% and an online rise of 13.1% in 2023.
Online dollar share continues to siphon from brick-and-mortar for the pet care industry, a trend that can be seen across all other industries. According to Binder, the pet industry’s online dollar share rose 1.8 points in 2023 compared to 2022, one of the higher rises throughout all industries.
“Pet care again falls right alongside health and beauty and baby care,” she said. “The three departments have been trending in line with each other from the last few years, but as we look to the growth trends, we can actually see that that online contribution for pet care is growing faster than all the other departments, other than gen merch.”
Looking to consumers of pet care products, in 2023 there were 113 million pet care-buying households in the United States, an increase of 2.3% from 2022. This represents an 89% penetration rate, an increase of 0.2 points from year-ago. NielsenIQ estimated an average spend of $738 per buyer in 2023, an increase of 7.4% from 2022. It’s important to note that these households only accounted for buying pet care products, yet they may not all own a pet.
Breaking this down further, Binder shared that in 2023 there were an estimated 61 million dog-owning households purchasing pet care products, an increase of 1.8% from 2022, and an estimated 38 million cat-owning households purchasing pet care products, an increase of 3.7% from 2022.
Not only are cat-owning households growing at a faster rate than their dog-owning counterparts, but these households are also known for spending more on pet care. Cat-owning households were estimated to have an average spend of $1,056 per buyer in 2023, an increase of 6.3% year-ago, whereas dog-owning households had an average spend of $980 per buyer, an increase of 7.9% from 2022.
Diving into where these consumers typically shop for pet products, Binder detailed nearly 80% of dollars were spent by omnichannel shoppers, those that utilize both in-store and online purchasing, in 2023. Fifty-seven percent of total pet care buyers purchased via omnichannel, an increase of 1.5% from 2022.
Despite omnichannel’s hold, in-store only purchasing remains popular with 39.7% of buyers, a decrease of 1.2% from 2022, and accounted for 19.3% of dollar sales, a decrease of 1.9% from 2022. Online-only buyers are even less common at just 3.3% of total pet care buyers, an increase of 0.3% from 2022, representing a mere 2.5% of total dollar sales, also an increase of 0.3% from 2022.
Pet food drives omni growth
Breaking this omnichannel data down by category, Binder revealed the pet food segment is the slowest to turn to online purchasing. In 2023, a majority (69.1%) of pet food sales were held by in-store retailers and only 30.9% were through online retailers, a 0.9-point increase from 2022. For comparison, online sales share of pet treatments rose to 78.2%, a 1.6-point increase, and online sales share for pet supplies rose to 48.5%, a drastic increase of 3.2 points from 2022.
“Pet food is still predominantly purchased in-store and showing the slowest turn to purchasing online with nearly 31% of sales online, and nearly 70% of sales still remaining from an in-store perspective,” Binder shared.
Despite pet food’s slow turn toward online purchasing, the segment is majorly contributing to the rise of omnichannel purchasing, according to Binder. The majority of pet consumables, which includes dry dog food, dry cat food, wet dog food, wet cat food, dog treats and cat treats, are all witnessing growth both online and in-store in terms of dollar sales.
In examining buyers of pet consumables and litter, Binder detailed more than half (51.4%) of these buyers are seeking omnichannel options, an increase of 1.3% from year-ago. Omnichannel pet food and litter sales accounted for 71.8% of total category sales in 2023, an increase of 0.8% from 2022.
Within this consumables category, in-store purchasing is still trending. In-store accounted for 45.1% of buyers in 2023, a decrease of 1.7% from 2022, and made up 25.1% of total dollar sales, a decrease of 1.2% from 2022. Online only buyers are even less common in the pet consumables and litter categories, representing just 3.5% of buyers, an increase of 0.4% from 2022, and 3.1% of dollar sales, an increase of 0.4% from 2022.
“We still see some exclusively buying in-store for pet food and litter, and it’s a little bit higher [compared to total pet care buyers],” Binder said. “Exclusively buying online is also a little bit higher and the omni shopper is just a bit smaller in this space.”
As online purchasing continues to grow, Binder also shared that more pet food consumers continue to leverage subscriptions for additional convenience. Pet food subscription-based purchasing has quickly overtaken non-subscription online purchasing, resulting in a $141 million gap in dollar volume in 2023.
Stay tuned for upcoming consumer insights from NielsenIQ’s State of Pet report.
Read more of our Global Pet Expo coverage.