This article was published in the June 2020 issue of Pet Food Processing. Read it and other articles from this issue in our June digital edition.
From traditional kibble to raw food and treats, Americans have many affordable options when it comes to feeding their pets. There’s no doubt that people love to spoil their dogs and cats with delicious meals and snacks, yet there has never been a study to examine the immense purchasing power of the pet food industry and how it supports the agricultural economy – until now.
A few years ago, the animal food industry’s public charity, the Institute for Feed Education and Research (IFEEDER), conducted a study that looked at what ingredients are used in feed for the country’s top nine livestock, poultry and aquaculture species. The comprehensive study was the first time the feed industry had a solid grasp on the sheer amount of farm-grown crops, ingredients and food coproducts that are used to manufacture over 236 million tons of high-quality, nutritious feed for animals annually.
But the study did more than provide quantifiable data for the industry to use in conversations with policymakers and stakeholders. It sparked further questions about how much pets, specifically dogs and cats, consume annually in the United States and what ingredients are used most frequently in pet food and treats. Given that pet food manufacturers must purchase these ingredients from farmers, ranchers, ingredient manufacturers and other processors, questions also arose on how much the pet food industry is stimulating rural economies.
Pet food processors purchased 8.6 million tons of ingredients valued at $6.9 billion in 2018.
With these questions in mind, IFEEDER partnered with allied associations the Pet Food Institute (PFI) and the North American Renderers Association (NARA) to develop a study that would examine the economic impact pet food manufacturers have on the United States farm economy and the composition of pet food. It also took into account the ways in which the pet food industry strives to be more sustainable through the use of nutritious byproducts. Together, the associations hired Decision Innovation Solutions (DIS), an economic research and analysis firm out of Iowa, to develop a flexible study that would meet the needs of the three organizations’ memberships.
Study methodology
 Before launching into this research project, the partner organizations took time to recognize how the pet food marketplace differs from that of the feed industry, which DIS previously studied. For example, pets are often considered “family members,” and thus, pet food is often marketed and produced similarly to human food, with human health trends and fads carrying over into pet food. Pet food can use a variety of protein products as well as fruits and vegetables, providing diverse sourcing points to pet food manufacturers, and it does not need to be produced in close proximity to where it is sold. Also, with many breeds and sizes of dogs and cats and various stages of life, each with their own unique nutritional requirements, DIS recognized it could prove challenging to get a complete picture of the pet food industry.
DIS sought to analyze the total national pet food retail volume and sales; the upstream volume and sales (i.e., benefits to other industries through the purchases of ingredients and supplies); and ingredient composition. It chose to focus primarily on dry food, wet food and treats for both dogs and cats, as well as semi-moist food for dogs, along with a few subcategories under these types.
In order to conduct the study, DIS purchased Nielsen data on dog and cat food sales in the United States from June 1, 2018 through May 30, 2019, capturing SKU/UPC data for six pet food sales channels (Petco, Petsense, Petsmart, PetValue, supermarket and all other channels). However, the data only represented 68.3% of total national pet food sales, so DIS factored up its topline numbers by 1.465 to estimate total sales. Next, DIS collected data on the volume (i.e., package sizes and weight) and dollar value and determined which products, by UPC, represented 95% of dog and cat foods by volume.
Once the firm knew it captured most pet food sales, it could then conduct an analysis of the ingredients used most by order listed on the label and group them into subgroups. Using a methodology called “recipe reverse engineering,” DIS found the corresponding ingredient labels online, which also included the pet foods’ caloric contents and guaranteed analyses, and categorized and prioritized the ingredients into nutrient groups (e.g., animal protein vs. plant protein). Similar ingredients on the label, such as “carrots” vs. “dehydrated carrots” vs. “dried carrots,” were combined into one category. Then, DIS estimated how much of the ingredients were used in the products based on the nutritional information and price to get the total quantities.
 Put simply, the recipe reverse engineering allowed DIS to “pour out” the bag of pet food and put each kibble back into the bag — ingredient-by-ingredient — to achieve the nutritional value listed on the label at the price point given without knowing the exact pet food formulation. From there, DIS could estimate the total amount of that ingredient used and compare it to the national average prices for that ingredient during the time period studied to get the overall economic value of the ingredient.
The analysis included farm- and mill-based ingredients, fresh and frozen meat and poultry products, rendered protein meals, water, fishery products and ingredients, broth from animal and poultry products, and major minerals. Pet food additives, including preservatives, flavors, colors, vitamins and minor minerals and additives, were not measured.
The results
Overall, the research found that US pet food manufacturers are delivering back to the agricultural economy by using 8.65 million tons of animal- and plant-based ingredients for dog and cat food, at a value of $6.9 billion. Farm and mill-based ingredients topped the list at 4 million tons valued at $1.4 billion, followed by 1.83 million tons of meat and poultry products ($3.21 billion), 1.5 million tons of rendered protein meals ($563 million) and 289 thousand tons of animal and poultry fats ($153 million).
Of the $30.3 billion in dog and cat food sales in 2018, an analysis of labels found more than 500 ingredients — from major commodity crops to specialty fruits and vegetables to meat, poultry and seafood to rendered products — to provide complete nutrition for dogs and cats. This demonstrates that the industry is providing diverse options for pet food shoppers at various price points to fit their budgets and preferences.
“Pet food manufacturers are providing the nutrition pets need and want while supporting the agricultural industry’s environmental impact,” writes Robert Cooper, executive director of IFEEDER.
These ingredient purchases boost incomes for farmers and farm processors and stimulate additional economic activity through the purchase of farming inputs and supplies via the spending multiplier effect. The research found that the exchange of pet food ingredients leads to the purchase of an additional $5.3 billion in materials and services for farmers and farm suppliers. This includes inputs such as seed, fertilizer, fuel, machinery and labor. In addition, farm suppliers buy $4.1 billion in materials and services, such as fuel, fertilizer, equipment and labor, that they in turn sell to suppliers of farmers.
The research also found that sustainable ingredients are cooked directly into pet food. Often using leftover ingredients made from the production of human food, such as bakery or brewery items or parts of the animal that humans do not eat, pet food manufacturers are providing the nutrition pets need and want while supporting the agricultural industry’s environmental impact.
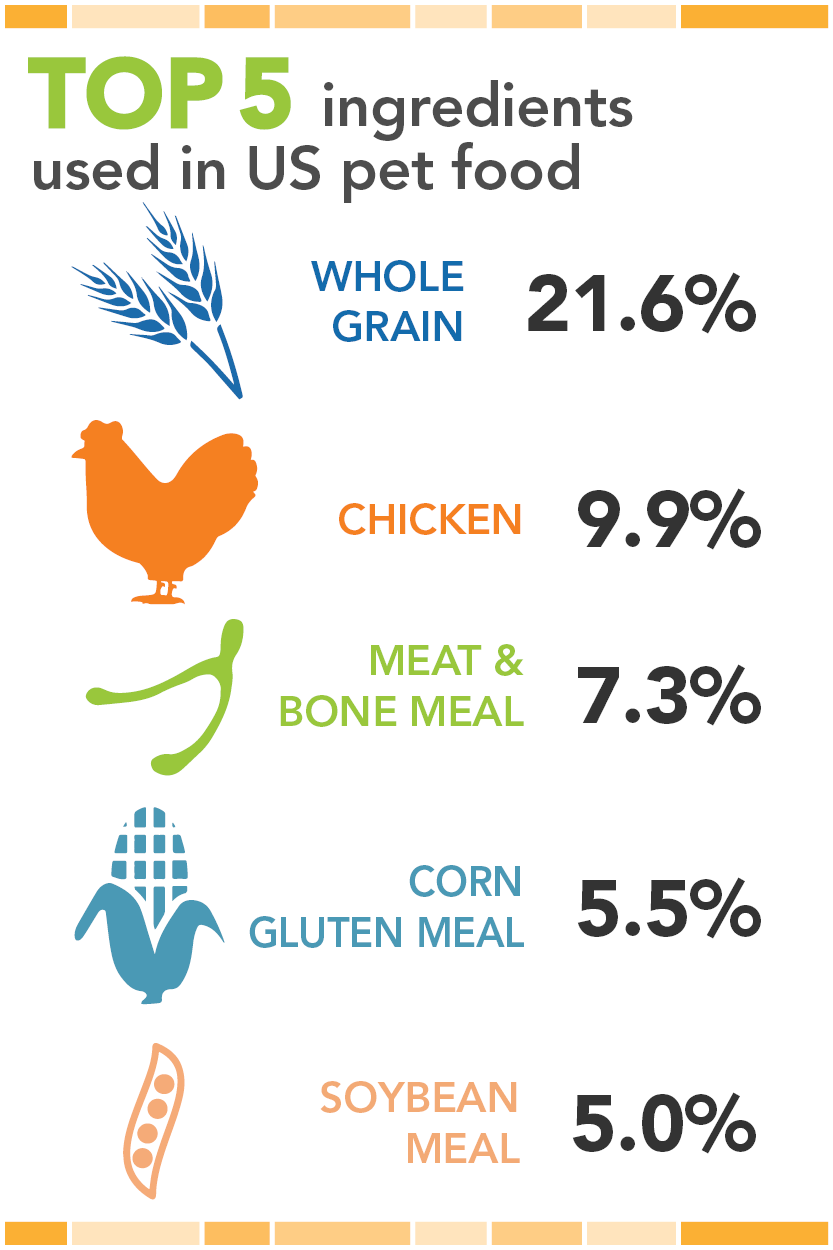
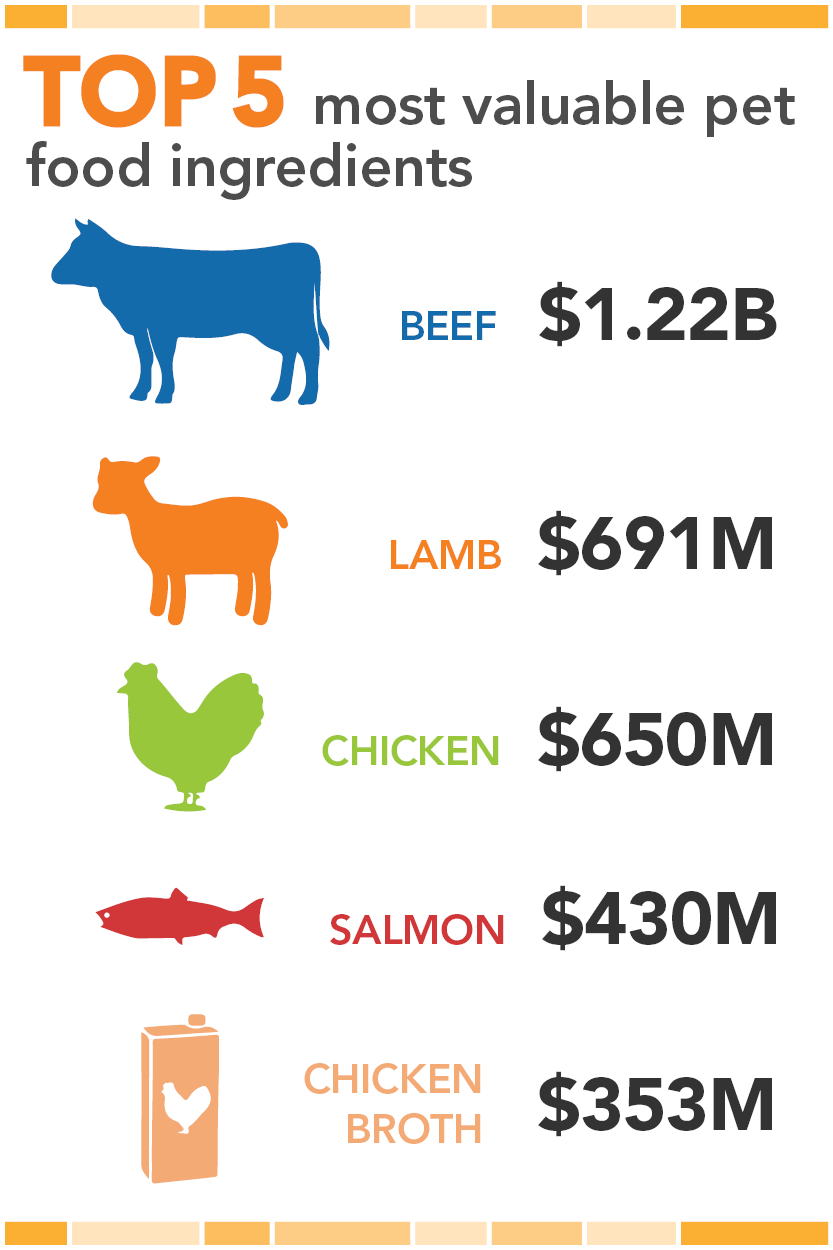
Other interesting findings showed that by weight, whole grains and chicken topped the list of ingredients used in pet food, whereas beef and lamb represented the top two most valuable ingredients used.
Of the 9.8 million tons of pet food produced, nearly 774,000 tons were consumed in Texas, followed by nearly 706,000 tons in California and roughly 510,000 tons in Florida, the country’s top three states by consumption.
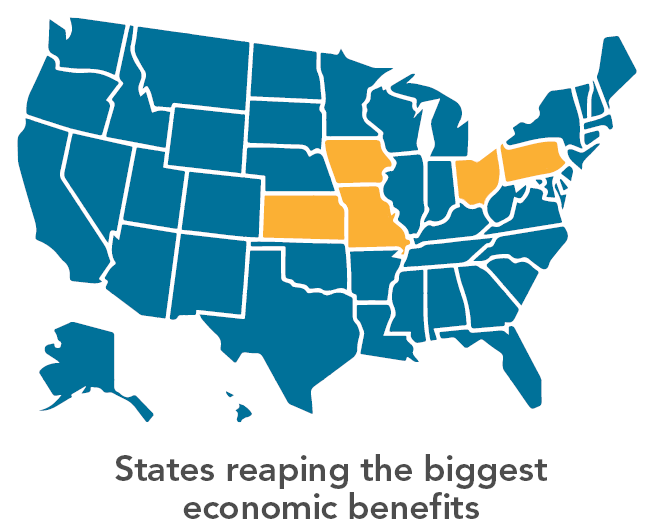 It probably comes as no surprise that the states reaping the biggest economic benefits from the pet food industry are situated primarily in the Midwest, where most crops are grown and most animals are raised. Manufacturers purchased the most products from farmers and farm processors in Missouri, valued at $999 million, followed by Kansas at $574 million, Pennsylvania at $571 million, Iowa at $422 million and Ohio at $367 million.
The demand for pet food is strong. The United States pet food industry will continue to thrive as it develops new, innovative solutions to meet the nutritional needs of pets and changing demands of consumers – all while reducing its environmental impact.
What’s next?
The partner organizations are conducting briefings with federal regulators and policymakers, commodity groups, state grain and feed associations and others so that they understand the pet food manufacturing industry’s economic impact and value in supporting rural agricultural communities. The full report and data, broken down by state and ingredient, can be found online at ifeeder.org.
If an organization is interested in learning more, reach out to Robert Cooper at rcooper@afia.org for more information or visit IFEEDER’s website.
Stay up to date on news about the pet food processing industry on our News page.